
PivotTables: The Idea
A PivotTable summarises a long list into a small grid. You pick which column forms the rows, which forms the columns and which number to add up, and Excel builds the table: Insert > PivotTable.
Behind every PivotTable is the same idea as SUMIFS: for each row and column heading, add the values that match. The example builds a summary by hand, so you can see exactly what a PivotTable calculates. Changing a heading is as easy as changing which column you match.
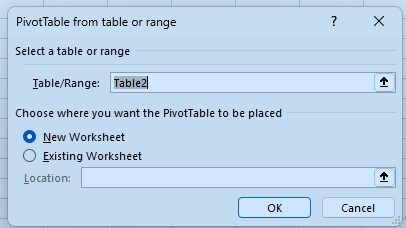
In Excel: click a cell in your table, open Insert and choose PivotTable. Keep the range and place it on a new worksheet.
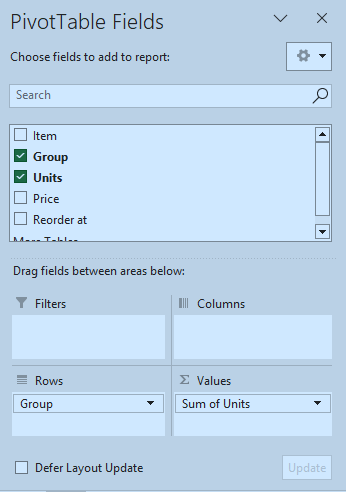
Then tick the fields to use. Ticking Group puts it in Rows; ticking Units puts it in Values as a sum.
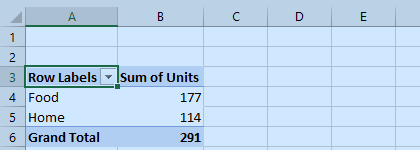
A PivotTable summarises data by...
Total units for each region in F2:F3 using SUMIFS (criteria is the region name in E2 and E3).
Finish the quick check (and any code exercise) to complete this lesson, or mark it done yourself.
Tip: use the left and right arrow keys to move between lessons.