
Excel Tables
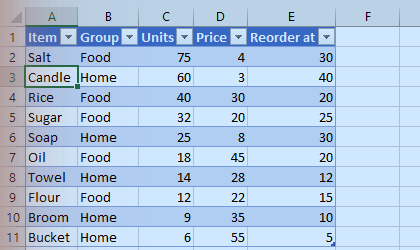
Turn a block of data into an Excel Table (Insert > Table, or Ctrl+T) and Excel adds filter buttons, banded rows, and formulas that grow automatically when you add a row. The rules for a clean table:
- One header row with a unique name for each column.
- One record per row, one fact per column.
- No blank rows or columns inside the data.
- No totals mixed into the data; put them below or beside.
Tidy data like this works with sorting, filtering, PivotTables and every function in this course. The example is tidy; the second block breaks the rules and is awkward to summarise.
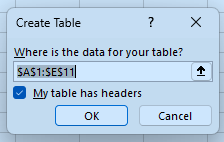
In Excel: click a cell in your data and press Ctrl+T. Check that the range is right and that "My table has headers" is ticked, then press OK.
The data gets banded rows and filter buttons, and a Table Design tab appears with the table options.

Which belongs in a tidy table?
Add a Value column: E2 to E4 should be Units times Price. Then E6 the total.
Finish the quick check (and any code exercise) to complete this lesson, or mark it done yourself.
Tip: use the left and right arrow keys to move between lessons.