
Data Bars, Colour Scales and Icon Sets
Three conditional formats turn numbers into pictures inside the cells:
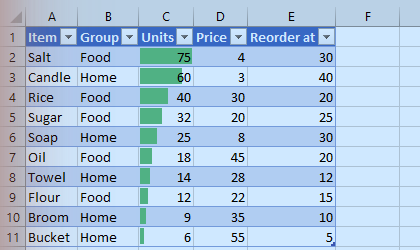
- Data bars draw a bar in each cell, longer for bigger values.
- Colour scales shade cells from one colour to another (low to high).
- Icon sets add arrows, flags or traffic lights by band.
All three come from the same recipe: scale the value, then show it. REPT("#", n) repeats a symbol n times, which gives a bar in plain text; IF or IFS chooses an icon. The example builds data bars and arrow icons from the numbers.
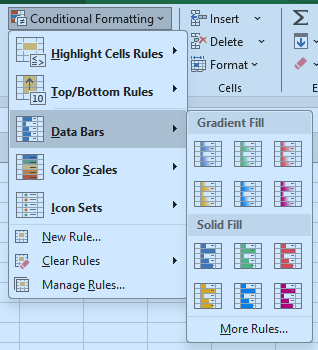
In Excel: select the numbers, choose Conditional Formatting on the Home tab, then Data Bars, Color Scales or Icon Sets.
Exampleexcel
Quick check
What does a data bar show?
Your turn: write the code
Draw a text bar for each value in A2:A4 in B2:B4: one * for every 10 (use REPT and ROUND).
Finish the quick check (and any code exercise) to complete this lesson, or mark it done yourself.
Tip: use the left and right arrow keys to move between lessons.