
Charts
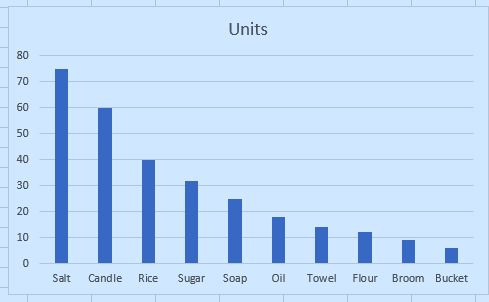
A chart shows data as a picture. In Excel select the data, then Insert > Charts (or Alt+F1 for a quick column chart). Pick the type to match the question:
| Question | Chart |
|---|---|
| How do categories compare? | Column or bar |
| How does a value change over time? | Line |
| What share is each part of a whole? | Pie (few slices) |
| Are two numbers related? | Scatter |
Always give the chart a title that states the message, label the axes with units, start bar charts at zero, and keep colours meaningful. The chart is only as good as the table behind it: clean, tidy data gives a clean chart. A text version below shows the shape of the data before you chart it.
In Excel: select the data (hold Ctrl to pick separate ranges, such as the names and one column of numbers), then open the Insert tab and choose a chart. Alt+F1 inserts a column chart at once.

Which chart suits sales over twelve months?
Find the month with the lowest sales and put its name in B7 (INDEX and MATCH with MIN).
Finish the quick check (and any code exercise) to complete this lesson, or mark it done yourself.
Tip: use the left and right arrow keys to move between lessons.